Weather Input for Non-point Data Simulation (WINDS)
Overview
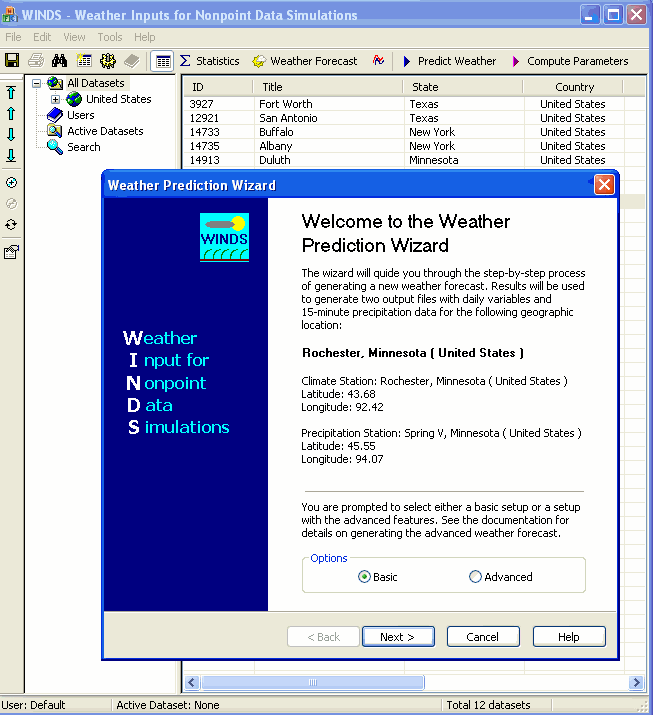
WINDS is a weather simulation tool that analyzes historical weather data and simulates many years of weather realization based on statistics computed from daily time series of weather data.

Framework
A two-step process is used:
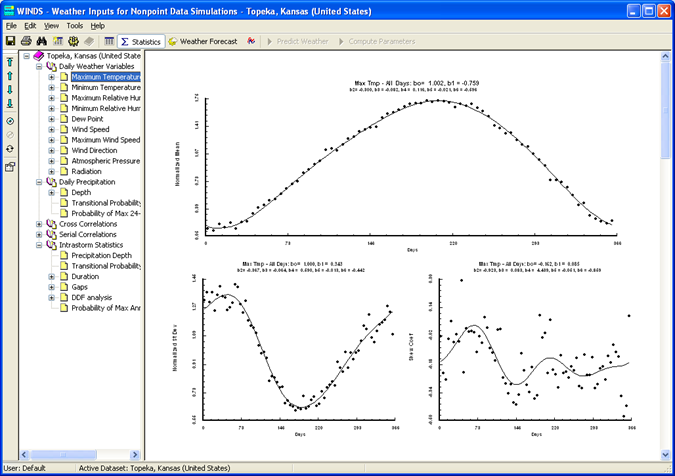
- The first step analyzes historical daily weather records to obtain relevant statistical information. Eleven 24-hour climate variables (minimum and maximum temperature, dew point, relative humidity, maximum wind speed, wind speed direction, solar radiation, atmospheric pressure, precipitation) are included in the historical data series by default. Each climate variable is represented by cosine functions with three harmonics and seven coefficients. The coefficients are calculated using non-linear regression analysis. Mean, standard deviation, and skews are computed daily for all non-precipitation data. Since the precipitation climate variable is a discontinuous function, a 28-day interval is used. Transitional probabilities of wet days given that the previous day is wet and given that the previous day is dry are calculated using the cosine fit function. WINDS also calculates cross-correlations and serial correlations between non-precipitation variables.
- The second step uses calculated at the first step statistics to generate time series of 11 weather variables. Non-precipitation variables are represented by continuous functions and simulated with a statistical framework of Markov processes. Discrete precipitation events are modeled using a first-order, two-state Markov chain. A transitional probability function is used to identify a rainfall event, and a log-normal probability density function distribution is used to determine precipitation depth for that rainfall event.

This two-step process allows WINDS to produce a continuous daily weather variable time series that closely resembles historical statistics. Additional features include normalization of each climate variable for easier scaling of daily results, various annual non-stationary trends, 5-day weather forecast that can be useful for short-term prediction, and daily adjustments for climate change scenarios.
Results
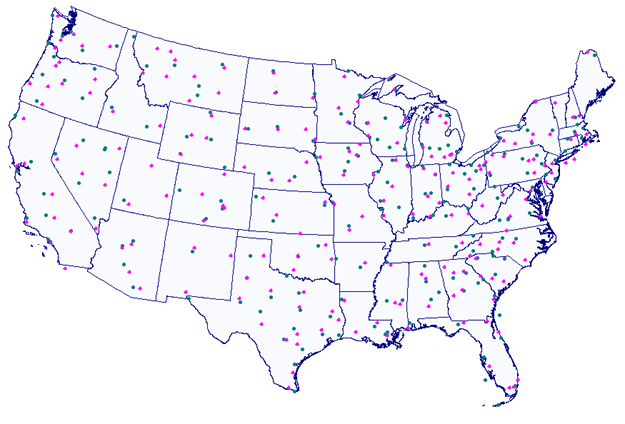
Long-term historical records from more than 200 weather stations throughout the United States were processed and statistics were calculated to form a default set of regression fits that can be immediately used for weather forecasting. User-specific historical data can be substituted and uploaded to WINDS for analysis.

Relevant publications:
- Sheshukov, A.Y., C. Siebenmorgen, and K.R. Douglas-Mankin (2011) Seasonal and Annual Impacts Of Climate Change On Watershed Response Using Ensemble Of Global Climate Models, Transactions of the ASABE, 54(6), 2209-2218.
- Wilson, B.N., and A.Y. Sheshukov (2011) Precipitation Parameters of Stochastic Weather Models for a Changing Climate, ASABE International Symposium on Erosion and Landscape Evolution, Anchorage, AK, 8 p.
- Siebenmorgen, C.B., A.Y. Sheshukov, and K.R. Douglas-Mankin (2010) Climate Change Impacts on Hydrologic Indices in Unregulated Watersheds in Kansas, TMDL 2010: Watershed Management to Improve Water Quality, ASABE Conference. Baltimore, MD. 8 p.
- Wilson, B.N., A.Y. Sheshukov, and R. Pulley (2006) Chapter 3: Modeling algorithms of the WINDS model, in Erosion risk assessment tool for construction sites, Minnesota Department of Transportation, Report MN/RC-2006-27, 72 p.
